Lunar Landing Site Navigator
If we land here, on this date, how long will we have sunlight and contact with Earth?
Click a site on the map → choose a landing date → press Play to watch sunlight and shadows move.
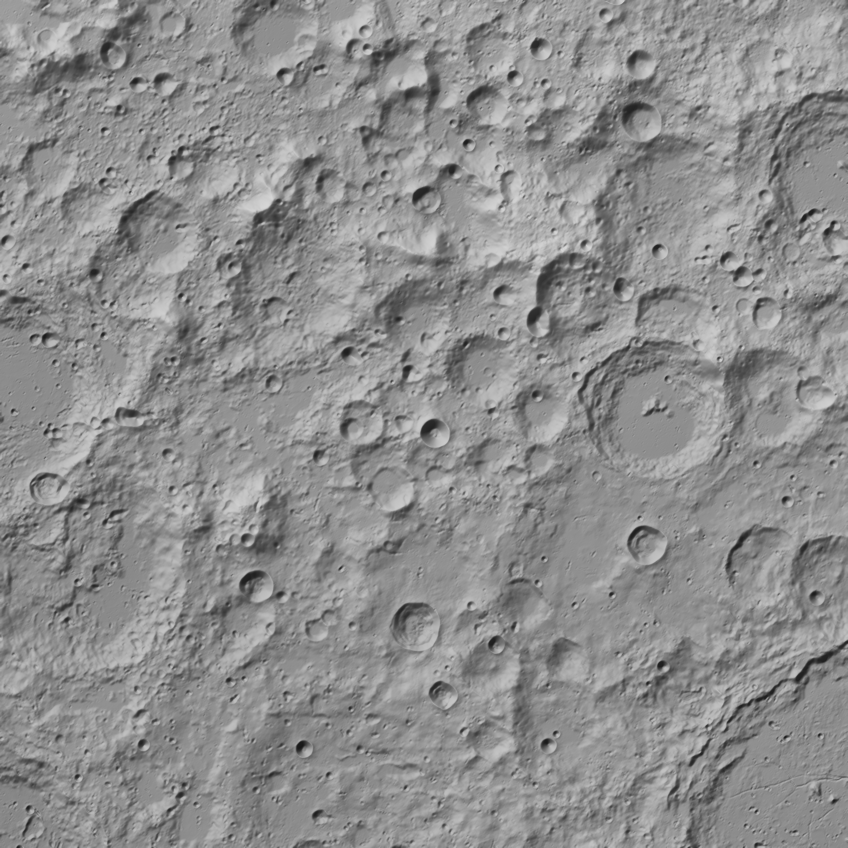 ↑ 0° · toward Earth90°E180°90°W
- illumination peak
- Artemis III region
- landed
- planned
Click a dot for a curated site, or anywhere for that point (120–240 m terrain).
Terrain shadows at the time on the slider above; press play to watch them sweep around the pole as the Sun circles. Approximate (720 m terrain).
Loading…
1. Where are the Sun and Earth?
NASA JPL's Horizons system gives the point on the Moon directly under the Sun and under Earth, every 30 minutes for 2026–2030, in the Moon's mean-Earth frame. From those we compute exactly where each appears in the sky from any landing site, including Earth's parallax.
2. What does the horizon look like?
We read elevation maps from NASA's Lunar Orbiter Laser Altimeter (LOLA) and cast 720 rays from the lander (2 m above the ground) out to 300 km, placing every sample exactly on the curved Moon. The highest terrain angle in each direction is the local horizon. There is no air, so no refraction: the horizon is just rock and the edge of the sphere.
3. Sunlight and Earth contact
The lander has sunlight when the Sun's center is above the terrain in its direction, and Earth contact when Earth's center is. We also report how much of the Sun's disk shows. Rise and set times are interpolated between 10-minute samples. Sunlight on a panel is the solar constant (1361 W/m² at 1 AU) scaled by the Sun's distance and visible disk, times cos(elevation) for a vertical panel facing the Sun or sin(elevation) for a flat one, before any panel efficiency.
Why the south pole is so hard
At the pole the Sun never climbs more than about 1.5° above a flat horizon; it circles around the sky once a month. Earth bobs up and down about ±7° as the Moon wobbles (libration). So a ridge a few degrees high, or a landing site a few hundred meters away, can turn two weeks of power into darkness.
How we checked it
- Sun and Earth directions match Horizons' own answers for observers on the lunar surface to within 0.0002° (Sun) and 0.006° (Earth) across 250 test cases.
- Physics sanity checks: equatorial sites get ~50% daylight over a lunar month and see Earth 100% of the time; far-side sites never see Earth; the floor of Shackleton crater (a permanently shadowed region) gets 0% sunlight over 2026–2030.
- Against a published illumination study (Gläser et al. 2018, Planetary and Space Science, 20 m LOLA maps, 2017–2037), our 2026–2030 average illumination is 80.0% vs 81.0% on Shackleton's rim and 85.7% vs 88.0% on the Shackleton–de Gerlache connecting ridge (2 m above ground).
- Terrain math is tested against shapes with known answers (smooth sphere, walls at known distances).
Limits
- Terrain detail matters: curated south-pole sites use 20 m near-field maps; custom coordinates use 120 m maps near the pole and 240 m farther out, and are approximate. Outside 75°S–90°S the Moon is treated as a smooth sphere.
- “Contact” means Earth is above the local horizon; it assumes a Deep Space Network station on Earth can see the Moon at that time (true most of the time with three stations).
- The Good/Fair/Poor mission ratings are our rule of thumb (hover the (i) next to “Mission brief”), not a NASA standard.
- The map layers (sunlight %, Earth contact %, live shadows) use coarser terrain (240–720 m) and are approximate. The 3D views stretch heights so low terrain is easy to see; directions and positions are exact.
- Dates are limited to 2026–2030, the period of the cached ephemeris.
Data: JPL Horizons (NASA/JPL-Caltech); LRO LOLA gridded topography (NASA GSFC, PDS Geosciences node, imbrium.mit.edu). Site coordinates are cited per site.